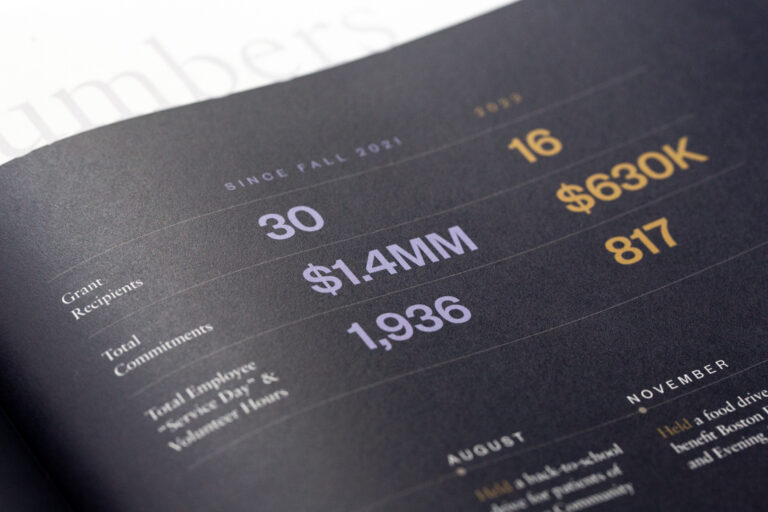
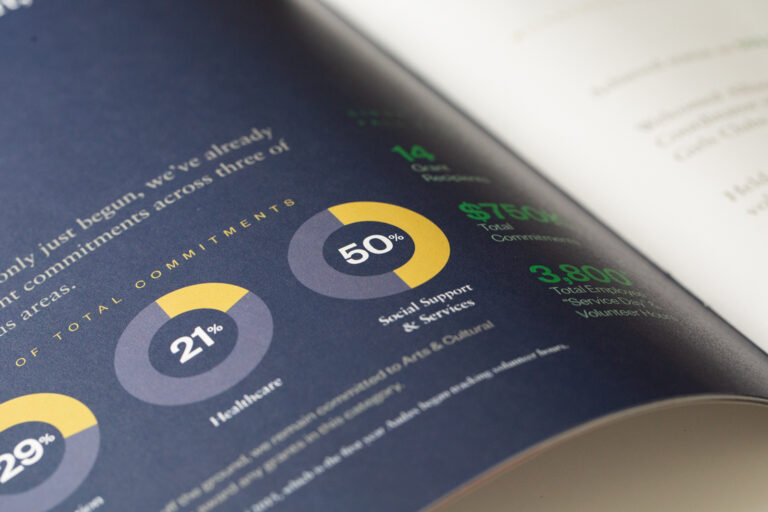
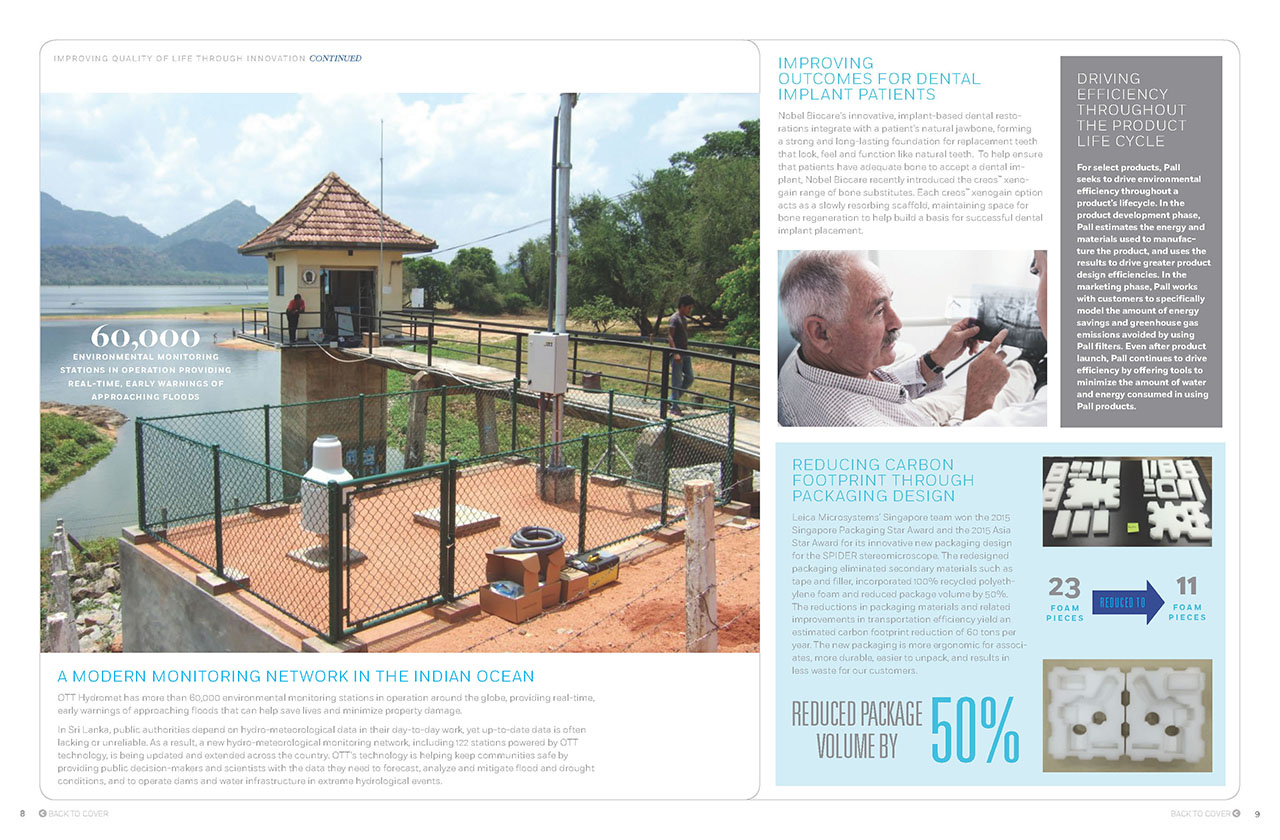
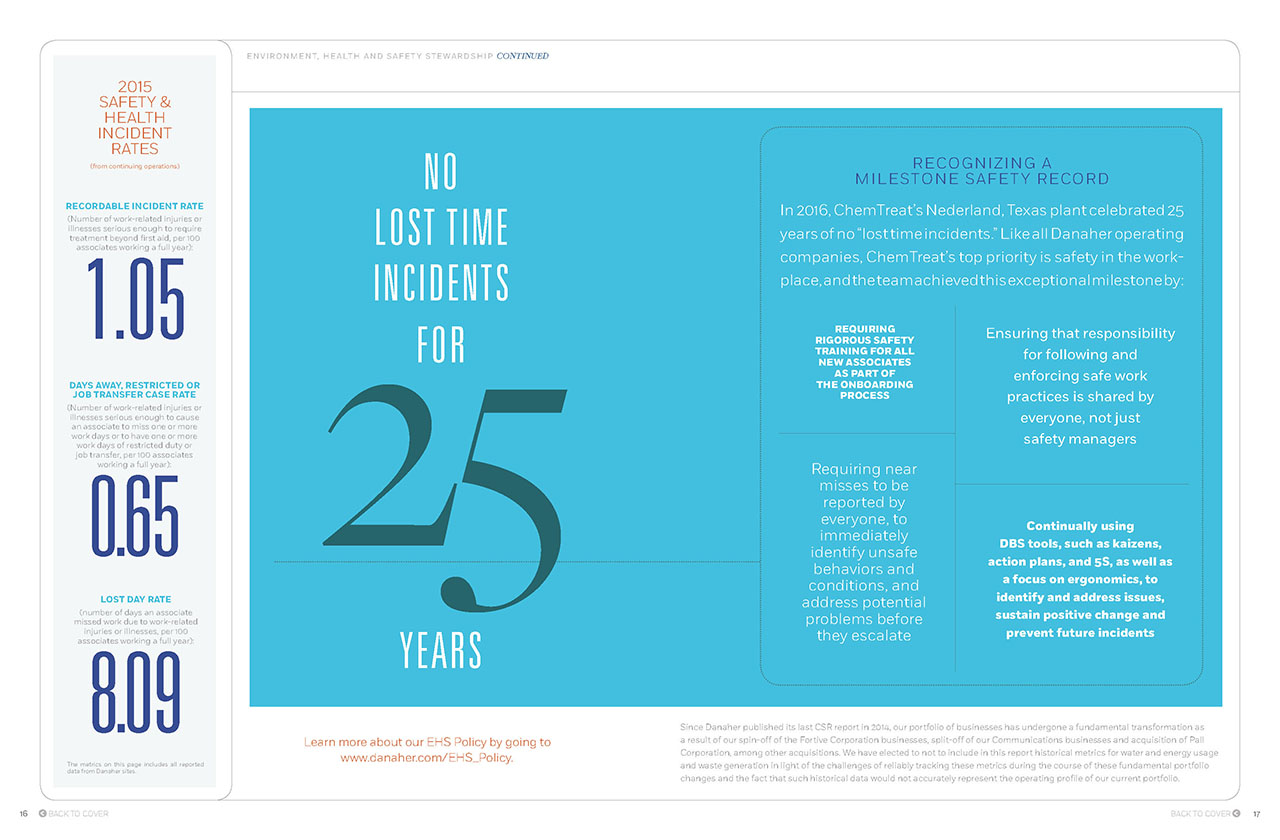
We knew there wouldn’t be many images to work with on this report, so typography, color and graphics became crucial tools. Our goal was to give each spread a visual starting point to show a lot of information and data, but still have it feel accessible and easy to read. The report was distributed in print and also as an interactive PDF.
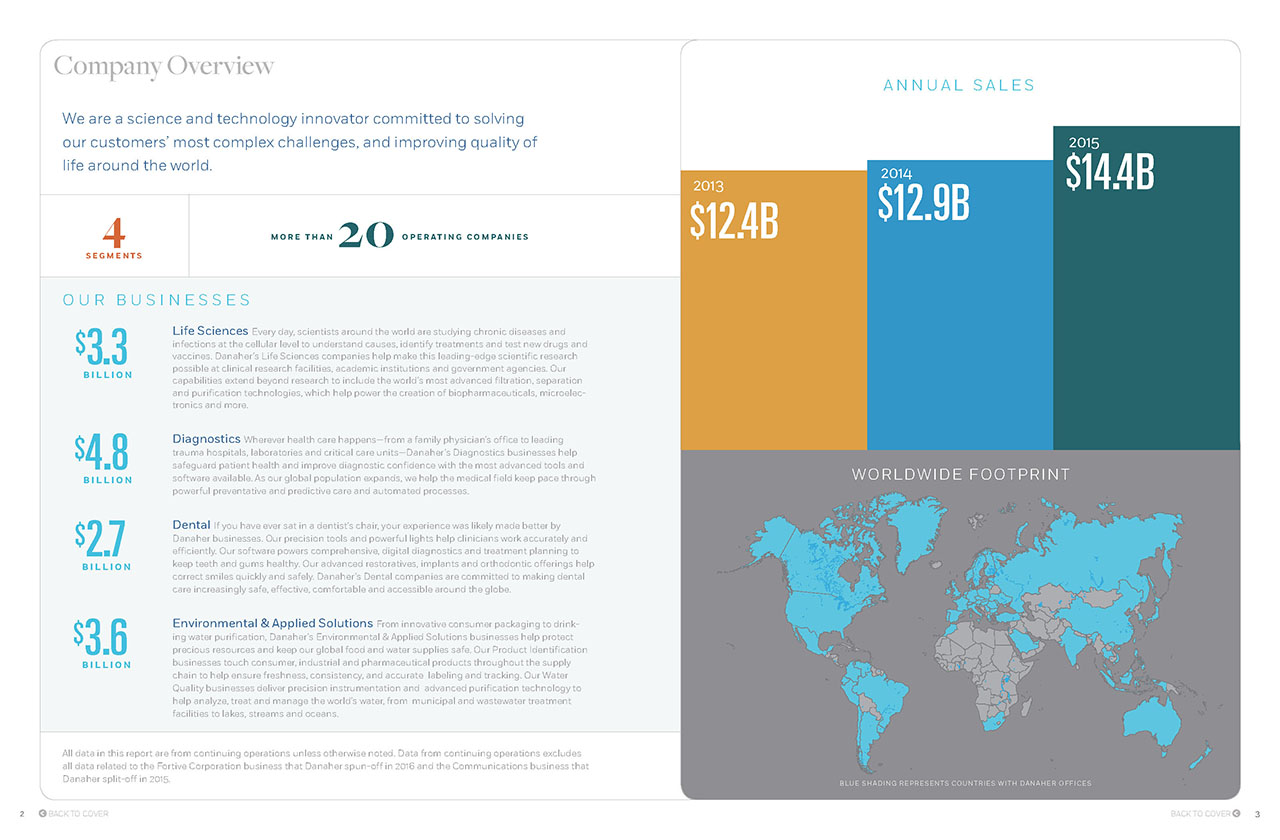
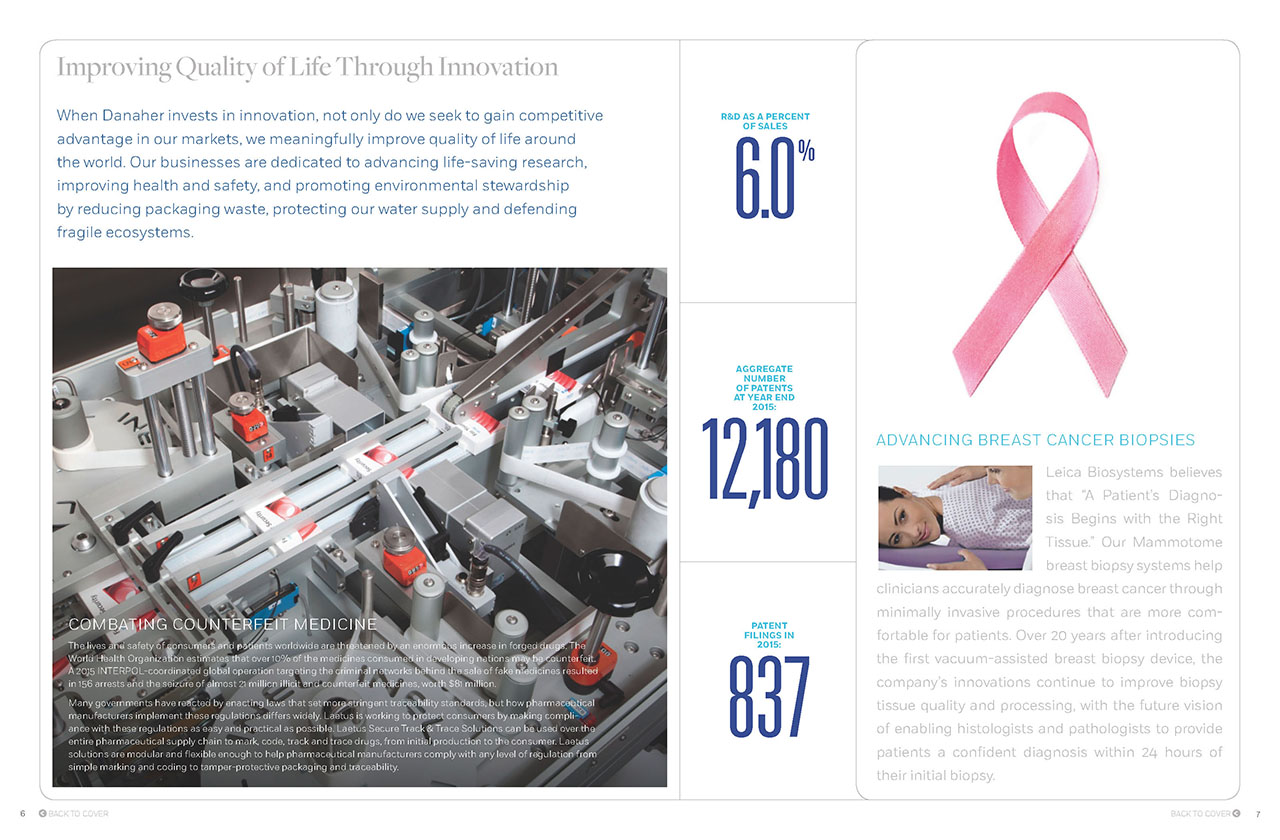
Large data points and dramatic typography keep text heavy content visual and inviting.